15. Make It Pretty: DIY Pirate Plots in ggplot2

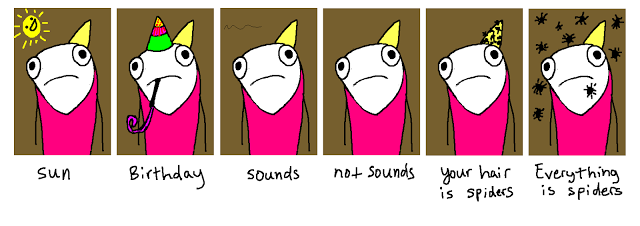
January. Is. Over. Though the world is on fire/everything is spiders, in my work-life, I am quite relieved: I have escaped the most gruelling month of continuos large deadlines that I’ve ever had to manage (#NewFacultyLife), while (mostly) getting everything done that I needed to. Hurray!

depression xalt.png
DJT is the Lord of Spiders

So now that I am entering a month when I will encounter the thing-of-myth referred to as, free time, I wanted to quickly hammer out a blog post to start getting back in the swing of posting more regularly. With that, it’s a new MIP post, this time focusing on making DIY “Pirate Plots”.

Continue reading

14. Heroic Women in Psychology, OR, $%&* Male “Eminence”

It’s been a rough go for psychology, these past few weeks. Trump’s election  has created a measurable depression in the field. PsychMAP was a virtual ghost-town for more than a few days. Many of us were desperate for something–anything–to give us a reason to not despair for the many types of people who will inevitably suffer under the Trump administration.

Enter: the Association for Psychological Science, to give us a reason to feel hopeful about the state of diversity in our field. Oh wait. My bad. That was in some other universe. Continue reading

13.Good, Cheap, and Fast: Evaluating Assumptions for Regression in R

Assumptions are maybe the weirdest part of doing statistics in psychological research. The vast majority of us rely on statistical tests that require certain assumptions to be met (i.e., parametric statistical tests). But for every 10 conversations I have about statistical analyses that involve the mention of “assumptions”, 9.9 of them end the same way: “Why are these assumptions needed, anyways? I know they are technically important, but what are the practical consequences of failing to meet them?” 

As it turns out, hardly any of us report on our assumption checks. And maybe it’s because hardly any of us understand how to correctly check on our assumptions. Damn assumptions–forever making an ass out of u and me. Continue reading

12. Self-Esteem and Sexuality: Help Fight Publication Bias by Sharing your Unpublished Data!

Friends, academics, colleagues, lend me your ears! Actually, keep your ears; it is your data of self-esteem and sexuality that I’d like. Together, with Dr. Emily Impett and James Kim (from my former/beloved lab at UTM), we are working on a meta-analysis of the association between global self-esteem and sexuality variables. That’s a pretty broad net, so to give you a better idea of the data we’re interested in, here are some examples of sexuality variables included, thus far, in our meta-analysis:

  • Safe-sex variables (e.g., attitudes, behaviours, beliefs, experiences with STIs and unintended pregnancy)
  • Permissiveness variables (e.g., sexual desire, # of sexual partners for various sexual activities, sociosexual orientation)
  • Sexual function variables (e.g., problem with sexual arousal/pain/orgasm, ratings of sexual satisfaction)
  • Sexual communication variables (e.g., condom negotiation, communication self-efficacy)
  • Consent-related variables (e.g., experiences with nonconsensual sex, sexual abuse)
  • Developmental sexuality variables (e.g., age of first intercourse, first sexual partner’s age)

If you have unpublished datasets–or papers that we have missed in our lit review process–containing variables like these, and global self-esteem, please contact us: Sexuality.selfesteem.meta@gmail.com

To make things a little easier: you can view our meta-analysis’s reference list here. If you know you have papers with relevant data, have a look (search for your name) and if you don’t see your articles listed, shoot us an email (we may have missed them, or may need more information from you to include them) and we’ll be happy to include them (and cite them!!). And if you have unpublished data that seems relevant, we would be thrilled to include those too, and either cite a paper of yours hailing from the same sample, or profusely thank you in our acknowledgements (if no such other paper exists).

Friends don’t let friends publish meta-analyses that have missed a big file drawer; help us combat publication bias in our meta-analysis by sharing your data today!
11. Make It Pretty: Scree Plots and Parallel Analysis Using psych and ggplot2

I’m back with a new Make It Pretty post. I’ve been quietly thrilled with how well my other two Make It Pretty posts have done. My post on visualizing various 2-way interactions (easily my most popular not-current-issue post) has been viewed over 1000 times, and more excitingly, is now the top hit if you google “2-way interaction ggplot2”. And though much less popular, I’m still happy with the ~300 views my meta-analysis visualizations post (on forest and funnel plots) has attracted–I even saw one of my funnel plots in the ‘wild’ shortly after! With this post, I’m going to be showing how you can use the psych package in conjunction with ggplot2 in order to create a prettier scree plot with parallel analysis–a very useful visualization when conducting exploratory factor analysis. Continue reading

10. On the OSF/OkCupid Data Dump: A Batman Analogy

Today, my worlds collide: I’m blogging about sexual/relationship science, scientific methodology, and Batman–three things I love talking about. I never thought that a cause to discuss the three, simultaneously, would manifest in a single issue. But here we are:

The post above was retweeted by a Twitter buddy, and my first reaction was likely the same had by many sexual/relationship scientists. “You mean I can finally use peoples’ answers to all those insanely interesting sexuality questions on OKC in my research!?” The result:

giphy

But then, when I went to the OSF repository where the data is located to read the authors’ description/justification of how the data were collected (tl;dr the authors wrote a program to “scrape” user content, after accessing OkCupid), and my elation quickly began to fade. Continue reading

9. A Disagreement with Dr. Baumeister on his Construal of Exploring Small, Confirming Big

What an unusual Monday I had this week… It began with a normal trek to Starbucks to get some work done, only to find that my paper for the Journal of Experimental Social Psychology’s (JESP) special issue on replicable methods had finally appeared in press online (somewhat expected). Dr. Roy Baumeister had apparently enjoyed my paper so much that he wrote a paper of his own, expanding on my proposal (very much not expected). My weird Monday ended with a surprise visit from a stray dog, and having it keep me awake all night until I could drop it off at animal control (it was not tagged or microchipped) the next day, but that is another story. Anyways, back to Dr. Baumeister…

I am a Nobody, in the community of Social Psychologists–with a capital “N”. My H-Index is 6, and I don’t yet have even 100 citations to my work (but I am so close now, y’all! :P). Baumeister, by comparison, is a HUGE Somebody; he has an H-Index of 141, and over 100,000 citations to his work–the first page of his Google Scholar profile has articles all cited over 1000 times!!! Suffice to say, when Somebody writes the following of a Nobody’s paper, Nobody takes notice:

I will particularly elaborate Sakaluk’s (in this issue) proposal that the optimal model is to explore small, confirm big. (p. 1)

But after my feeling of surprise passed, I read his paper, and I realized that Dr. Baumeister had misunderstood–and therefore misconstrued–some of the more important points of my proposal. I’m therefore using this blog post to set the record straight about my vision for the Exploring Small, Confirming Big approach, and what parts of Dr. Baumeister’s construal of Exploring Small, Confirming Big that I disagree with.  Continue reading

8. Why Civility Matters in the Replicability Discourse

I have to admit: I am more than a bit nervous to write this post. Many “big” events have transpired within the last week of the ongoing discourse regarding replicability in psychological science, and the resulting exchanges on Twitter, Facebook, and the blogosphere have seemed incredibly heated and personal. Most centrally, the widely-discussed (and embargo-leaked) commentary critiquing the Reproducibility Project was released in Science:

Only to be rapidly responded to with–err, preceded by–thoughtful critiques of the critique (and even critiques of the critiques of the critique) by the Reproducibility Project, and many others:

In the midst of all of the online activity, I have seen some pretty ugly behaviour, from one-off snide comments, to elaborate flame wars, including (but not limited to): name-calling, mean-spirited poetry, attempts to shame individuals from participating in the discourse, and appeals to authority intending to silence critical discussion. This is not the level of “scientific”communication that our discipline deserves–least of all now. And I felt like I needed to blog about this recent trend in online communication about replicability, because I actually feel hurt for many of the individuals involved, many of whom I hardly know at all. Continue reading

7. Make It Pretty: Forest and Funnel Plots for Meta-Analysis Using ggplot2

By now, I’ve made it pretty clear: I absolutely love the ggplot2 package for plotting visualizations of data. In fact, I’m pretty sure I’m addicted. But in the last couple of years, I’ve discovered another love–meta-analysis. Meta-analyses are often accompanied by two popular forms of data visualization: forest plots and funnel plots. In this post, I’ll show how quick-and-dirty forest and funnel plots can be created with the metafor package. After, I’ll show how we can instead use the ggplot2 package to create forest plots and use the ggplot2 package to create funnel plots, so that we can have pretty plots that are easy to change/stylize, and that can be produced regardless of which meta-analysis package for R that you elect to use. Continue reading

6. Make It Pretty: Plotting 2-way Interactions with ggplot2

ggplot2, as I’ve already made clear, is one of my favourite packages for R. And since that original post about ggplot2 remains one of my most frequently visited, I thought I would proceed with starting a series of posts called “Make It Pretty”, all about sharing ways of visualizing data that I think are attractive/effective/comprehensive. So with this inaugural MIP post, I will be covering how to plot 2-way interactions using ggplot2. Continue reading